|
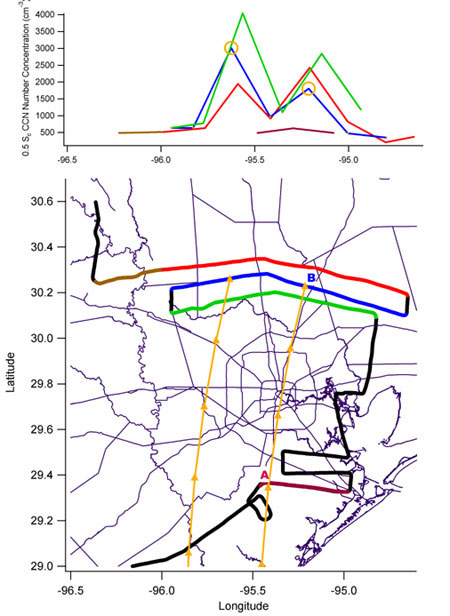
The figure shows CCN data from the SOAR Cheyenne II
during a flight downwind and upwind of Houston. Calculated backtrajectories are represented by the
two yellow
lines that terminate along the blue leg of the flight
track. The line colors used in the top graph showing
measured CCN concentration at 0.5% reflect the
position along the flight track shown on the map. CCN
concentrations immediately downwind of Houston were
observed to be as much as 10 times higher than that
measured on the east, west, and south sides of the
urban plume. The cause of the bimodality in
concentration is not known, although similar
observations were made during the TexAQS study in
2000.
The HEAT project was funded by the National Science
Foundation through the Texas A&M University (TAMU)
Aerosol Research group. |